Table of Contents | ![]() Print This Page
Print This Page
3. Surveillance Programs
- Issued: September 2014
- Content last reviewed: September 2014
3.1 Surveillance Criteria
The average member of the population receives an annual radiation dose of 2 to 3.4 millisievert (mSv) from background radiation. This natural background radiation is made up of cosmic radiation, plus radiation from potassium, uranium and thorium that are present in the soil, and radon gas in houses.[R-2]
Health Canada's guidelines for the radiological characteristics of drinking water are based on a committed effective dose of 0.1 mSv from one year's consumption of drinking water.[R-3] This figure is 10% of the International Commission on Radiation Protection (ICRP) suggested dose limit to the public.
Ontario's current Drinking Water Quality Standards for radionuclide concentrations are also based on the 0.1 mSv dose limit.[R-5] Subsequently, the objective of the ORSP is to measure radionuclide concentrations which if received for a year would give a dose commitment of 0.1 mSv to a member of the public from either inhalation or ingestion.
3.2 Program Design
The radioactive elements associated with routine and accidental release from a CANDU reactor are well known and can follow a number of pathways in the environment before entering the human system. Monitoring these radionuclides in the environment requires specific programs be in place. Air, drinking water and food are each of particular concern. The ORSP is comprised of three principal surveillance programs and four special studies programs.
Surveillance programs:
- air particulates
- drinking water
- tritium-in-air
Special Studies programs:
- precipitation
- milk
- recreational surface waters
- foodbasket – milk and vegetation
3.3 Site Selection & Program Summary
There are five nuclear installations currently in operation within or near Ontario's borders. Located north of Ottawa on the Ottawa River are the Chalk River Nuclear Laboratories. The Darlington and Pickering nuclear generating facilities are situated along the northern shore of Lake Ontario. The Pickering generating facility is on the eastern edge of the Greater-Toronto-Area while the Darlington generating facility is located east of Oshawa. The Bruce Power generating facility is situated on the north-east shore of Lake Huron. The Fermi-2 reactor, located 15 km south of Detroit, Michigan rounds out the list. This facility is near Windsor, another large urban centre.
The RPMS has designated seven surveillance areas for use in the ORSP which are listed below:
ORSP Surveillance Areas
- Arthur – control station
- Bruce – Bruce Power (formerly "Bruce Nuclear Power Development")
- Darlington – Darlington Nuclear Generating Station
- Essex – Fermi II Nuclear Generating Station (located in Michigan)
- Pickering – Pickering Nuclear Generating Stations
- Ottawa – Chalk River Nuclear Laboratories
- Toronto – water treatment plants
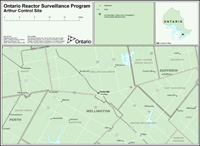
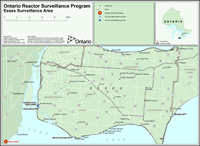
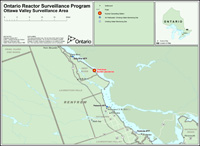
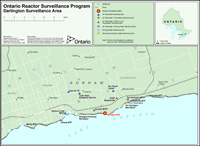
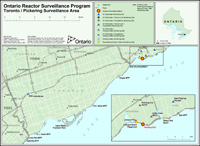
Sampling sites were located within each area using weighting factors for population density and distance from the facility. A complete listing of the monitoring sites and the programs carried out at these sites is provided in Table 2a and Table 2b. Maps 1 – 6 show the location of the individual monitoring sites within their respective surveillance areas.
The town of Arthur has been chosen as the control site for the ORSP as it is located mid-way between the Bruce and Pickering/Darlington Surveillance areas. Air samples collected here receive minimal possible exposure from these installations. Drinking water samples taken at Arthur, as measured by an independent laboratory, are extremely low in tritium and are used as a background blank by the RPMS.
Water treatment plants in the eastern part of the Toronto Surveillance Area are used to monitor drinking water for emissions from the Pickering nuclear generating facility. There are no water treatment plants in the Pickering Surveillance Area.
3.4 Derived Survey Concentrations
Health Canada's guidelines for the radiological characteristics of drinking water, are based on a committed effective dose of 0.1 mSv from one year's consumption of drinking water.[R-3]
For the purpose of monitoring radionuclides the 0.1 mSv committed effective dose is expressed as a Derived Survey Concentration (DSC). The DSC has been determined for each of the radionuclides that are of interest in water using the Ontario Drinking-Water Quality Standards. In the absence of a formal exposure guideline for radionuclides in air the DSC has been determined using the associated DSC for water divided by 10. Together, the DSC for water and air are listed in Table 1.
| Radionuclide | DSC – Water[ 1 ] (Bq/L) |
DSC – Air (Bq/m3) |
|---|---|---|
| Be–7 | 4000 | 400 |
| Co–60 | 2 | 0.2 |
| Sr–90 | 5 | 0.5 |
| Cs–134 | 7 | 0.7 |
| Cs–137 | 10 | 1.0 |
| H–3 | 7000 | 700 |
| I–131 | 6 | 0.6 |
3.5 Minimum Detectable Concentrations
The amount of radioactivity in a sample is calculated from the difference between the count rate with the sample in the counter and the "background" count rate when there is no sample in the counter. The background count rate is produced by the natural radiation present in the earth, fall-out from atomic bombs and cosmic radiation from space. Because of the random nature of radioactive decay, there is a statistical uncertainty associated with every measurement.
The minimum detectable activity (MDA) for a particular nuclide, analysis method, and counter is the smallest amount of radioactivity that will be distinguished from background in 95 out of 100 measurements. The minimum detectable concentration (MDC) is the minimum detectable activity expressed in terms of concentration per unit volume. Often, these terms are used interchangeably since the difference between MDA and MDC is in the conversion of the units.
In this report, the MDC is used as the majority of measurements are quoted in concentration units. For most nuclides, the MDC has been set at 10% of the DSC. However, for tritium in drinking water, because the DSC is so much higher, a laboratory reporting limit of 5 Bq/L is used for the MDC which is less than 0.1% of the DSC.
3.6 Data Handling For Unreported Data
Often, the results of the analysis of environmental sampling results are reported as less than the Minimum Detectable Concentration (MDC). This will produce a right-centred distribution of the results which are cut off below the MDC. It is important that this unreported or "missing" data be managed efficiently or an inaccurate inference may be drawn from the overall result.
There are several different strategies, sometimes referred to as "data imputation," which can be applied where the unreported values are replaced by a single value. This value may be chosen as the MDC, the MDC/2 or the MDC/√2. When this approach is used, however, the overall effect may bias the results if a large number of unreported values make up the data.
An alternative to data imputation is the use of regression estimation as a technique to replace the missing data. This approach is what has been used with the results of measurements from the water treatment plants that are made by the RPMS. In this method the variable with the missing values is treated as the dependent variable. The data is ranked from smallest to largest with those values that are below the MDC treated as the smallest values. The non-censored data is plotted on a scatter plot and should result in a straight line. Using this result a line of best fit can be drawn or calculated which will yield the regression equation. Through the use of this equation missing values can be predicted and the median and standard deviation of the data can be estimated.[R-4]
Table 2a: RPMS Surveillance Areas - Bruce, Essex and Ottawa
Bruce
| Monitoring Site | Map Number | Air Particulate | Tritium-in-Air | Drinking Water | Precipitation | Recreational Surface Waters | Foods – Milk |
|---|---|---|---|---|---|---|---|
| Arthur Control Site |
1 | √ | √ | √ | √ | ||
| Kincardine WTP | 2 | √ | √ | ||||
| Southampton WPCP | 2 | √ | |||||
| Bruce Power GS Visitor’s Centre | 2 | √ | √ | √ | |||
| Tiverton P.S. | 2 | √ | √ | ||||
| Scott Point P.S. | 2 | √ | √ | ||||
| 6 dairy farms | 2 | √ | |||||
| Inverhuron Park Beach, Scott Point & Port Elgin Beaches | 2 | √ |
Essex
| Monitoring Site | Map Number | Air Particulate | Tritium-in-Air | Drinking Water | Precipitation | Recreational Surface Waters | Foods – Milk |
|---|---|---|---|---|---|---|---|
| Arthur Control Site |
1 | √ | √ | √ | √ | ||
| Canadian Coast Guard Station | 4 | √ | |||||
| Amherstburg WTP | 4 | √ | |||||
| Harrow-Colchester WTP | 4 | √ | |||||
| Wheatly WTP | 4 | √ |
Ottawa
| Monitoring Site | Map Number | Air Particulate | Tritium-in-Air | Drinking Water | Precipitation | Recreational Surface Waters | Foods – Milk |
|---|---|---|---|---|---|---|---|
| Arthur Control Site |
1 | √ | √ | √ | √ | ||
| Deep River WTP | 5 | √ | √ | ||||
| Pembroke WTP | 5 | √ | |||||
| Petawawa WTP | 5 | √ | √ |
Table 2b: RPMS Surveillance Areas – Darlington, Pickering and Toronto
Darlington
| Monitoring Site | Map Number | Air Particulate | Tritium-in-Air | Drinking Water | Precipitation | Recreational Surface Waters | Foods – Milk |
|---|---|---|---|---|---|---|---|
| Ajax WTP | 3 | √ | √ | √ | |||
| RCMP Bowmanville | 3 | √ | √ | √ | |||
| Bowmanville WTP | 3 | √ | |||||
| Ken Hooper Fire Hall | 3 | √ | |||||
| Trull’s Road Emergency Services | 3 | √ | |||||
| Newcastle WTP | 3 | √ | |||||
| Oshawa WTP | 3 | √ | √ | ||||
| Whitby WTP | 3 | √ | |||||
| Nash Rd. P.S. | 3 | √ | |||||
| Harmony Creek WPCP | 3 | √ | |||||
| Courtice WPCP | 3 | √ | √ | ||||
| Port Darlington WPCP | 3 | √ | √ | ||||
| Darlington Provincial Park Beach & Port Darlington West Beach | 3 | √ |
Pickering
| Monitoring Site | Map Number | Air Particulate | Tritium-in-Air | Drinking Water | Precipitation | Recreational Surface Waters | Foods – Milk |
|---|---|---|---|---|---|---|---|
| Pickering Fire Hall #5 | 6 | √ | √ | √ | |||
| Ajax-Pickering Hospital | 6 | √ | |||||
| Liverpool P.S. | 6 | √ | √ | √ | |||
| Duffin Creek WPCP | 6 | √ | √ | √ | |||
| 9 dairy farms | √ | ||||||
| Liverpool Beach Playground & Rotary Park Beach | 6 | √ |
Toronto
| Monitoring Site | Map Number | Air Particulate | Tritium-in-Air | Drinking Water | Precipitation | Recreational Surface Waters | Foods – Milk |
|---|---|---|---|---|---|---|---|
| Horgan WTP | 6 | √ | |||||
| R.C. Harris WTP | 6 | √ | |||||
| Island WTP | 6 | √ | |||||
| R. L. Clarke WTP | 6 | √ | |||||
Toronto-west
| Monitoring Site | Map Number | Air Particulate | Tritium-in-Air | Drinking Water | Precipitation | Recreational Surface Waters | Foods – Milk |
|---|---|---|---|---|---|---|---|
| RPS Laboratory | 6 | √ | √ | √ | |||
| Lakeview WTP | 6 | √ | |||||
| Lorne Park WTP | 6 | √ | |||||
Maps
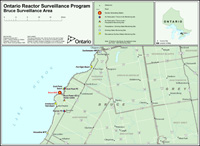
Map 2: Bruce Surveillance Area
ISSN 1929-2899

#worksafeON | #workfairON